plot_muts
Plot mutations either by comparing two sequences or by comparing a bunch of sequences to another sequence.
This command is still under a bit of development so bare with the nuances
Example comparing multiple sequences against a query sequence
--refs is a fasta file containing multiple sequences where the sequence that has
the earliest date will be used as the base reference.
--query is a fasta file containing a single sequence to be plotted in a different
color to see how it compares.
plot_muts --refs tests/testinput/refs.fas --query tests/testinput/query.fas --out plot.png
The --out option is optional. If it is not provided, the plot will pop up on
the user’s screen automatically. If this does not work, try saving the image using --out instead.
Example Output
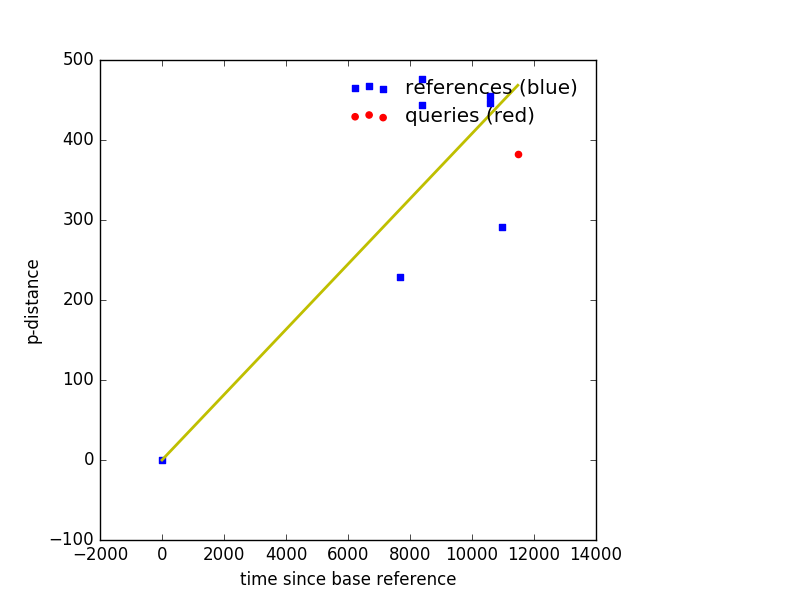
Plot muts also outputs a csv file named after the --out with .csv appended
name,dates,p-dist
Ref_gi|499073378|gb|KC807176.1|_Houston_virus_strain_V3982_complete_genome____2004,8401,476
Ref_gi|499073386|gb|KC807178.1|_Houston_virus_strain_16757_complete_genome____2010,10592,455
Ref_gi|499073382|gb|KC807177.1|_Houston_virus_strain_16740_complete_genome____2010,10592,446
Ref_gi|499073374|gb|KC807175.1|_Houston_virus_strain_V3872_complete_genome____2004,8401,444
Query_A12x2520____08_16_2012,11478,383
Ref_gi|557884407|gb|KF522691.1|_Nam_Dinh_virus_isolate_SZ11706Z_complete_genome____2011,10957,291
Ref_gi|341819796|gb|DQ458789.2|_Nam_Dinh_virus_isolate_02VN178_complete_genome____2002,7670,229
BaseRef_gi|499073354|gb|KC807170.1|_Ngewotan_virus_strain_JKT9982_complete_genome____1981,0,0
Input File Requirements
The input must be fasta format. Both the query and ref files can have any number of sequences.
The year should be the last part of the ID, preceded by a quadruple underscore. e.g.:
>some|info|blah_blah____2001_09_2010
>some____1995
>some____09/09/2012
If the ID uses ‘/’ rather than underscore, plot_muts currently accepts the year as the fourth field. e.g.:
>some/info/blah/1995
>some/info/blah/1995/more/info
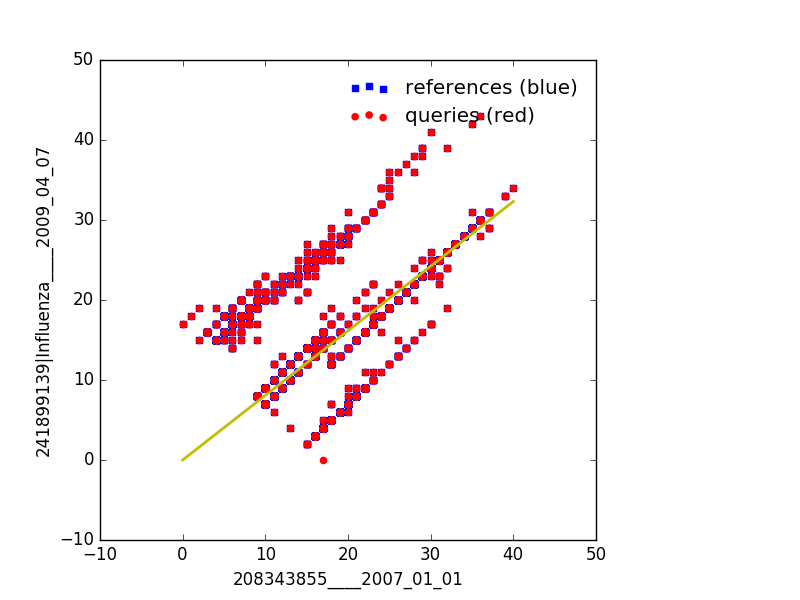
Example using cluster method to use two references as x and y axis
This is useful when you only have two references and no dates as all the sequences will be compared against these two sequences to give you a ‘clustered’ view
--refs is a fasta file that contains two references. The first being the
x-axis and the second representing the y-axis
--queries is a fasta file that contains multiple sequences that will be
plotted against the --refs sequences
plot_muts --query tests/testinput/ha/refall.ha.fasta --refs tests/testinput/ha/refall.ha.fasta --cluster --out cluster.png
Example Output
Generating html graphics that are interactive
For both --cluster and non-cluster graphics you can optionally supply --html
which will utilize the bokeh python project to build an interactive html output that
you can open in your web browser.